Rain

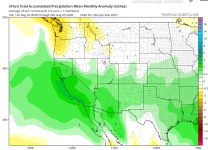
Well here's hoping for things that we can all agree to complain about weather wise...

I actually didn't have spiders on my Bingo card for this thread...
😅
 
Well here's hoping for things that we can all agree to complain about weather wise...

I actually didn't have spiders on my Bingo card for this thread...
😅

or termites! 😂
SF
 
This just popped up on my weather nerd site. It's a way out in fantasy land for Dec-Jan-Feb. It's a Climate Forecast System (CFS), model forecast. CFSv2 is global seasonal climate forecast model that predicts weather patterns on weekly-to-monthly time scales (not day-to-day). I hope it's wrong...

1786056674068.png
 
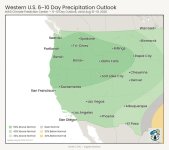
Accuweather shows mid to upper 80's and sunshine for Central Wa I don't see any rain or a chance next week. Called for a chance of thunderstorms yesterday afternoon however it was smokey and blue skys in between smoke patches
 
Accuweather shows mid to upper 80's and sunshine for Central Wa I don't see any rain or a chance next week. Called for a chance of thunderstorms yesterday afternoon however it was smokey and blue skys in between smoke patches
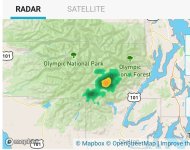
Three hours of thunder and lightning last night with five minutes of rain (probably localized rain). The brief rain lowered the AQI from mid 160's to 87 which I think will be brief given all the lightning strikes last night.
 
We are up in Sunlakes and camped through it. Rained more here and heavy at time especially when the thunder came just a couple seconds after the lightning. Wild night. You know how to put on a good show Pat.
 
Everyone on that map needs to wash their cars this week!
Matt I fear the concrete message you wrote here will be lost on @Stonedfish. You will lose him at Car Wash well before the joke lands.

Why disrupt external and internal microclimates of mildews, mosses, lichens, thermomicrobia and algae slimes that, at some fundamental level, re-harvest the carbon output of his rig?

His arc towards a carbon-neutral truck is underway, and car wash threatens this ongoing science/art proof-of-concept trial.
 
Screenshot_20260813_162936_Chrome.jpg
There it is...
 
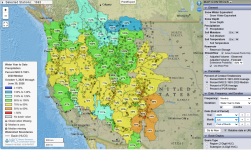
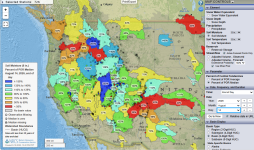
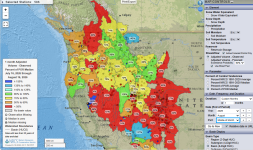
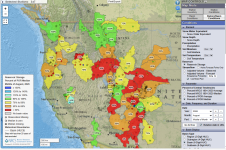
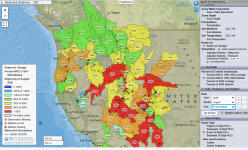
Latest reporting for August *🤔
1786895937761.png
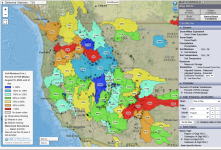
*latest for all stations reporting
1786897253957.png
1786896177113.png
😯
1786896417758.png
 
Latest reporting for August *🤔
View attachment 190557
*latest for all stations reporting
View attachment 190560
View attachment 190558
😯
View attachment 190559
Brian: Am I reading this last map correctly?? WA, and more specifically NCW is getting 90 to 109% precip? Last October must have been 90% of that figure. Seriously, talk to the Fire fighter guys and they will tell you this is the worse of worse they have ever seen with lack of humidity, intense heat, and wind. I would like to see precipitation accumulations from Jan through Aug 15!
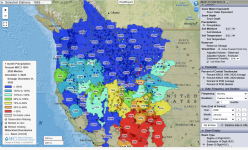
 
Brian: Am I reading this last map correctly?? WA, and more specifically NCW is getting 90 to 109% precip? Last October must have been 90% of that figure. Seriously, talk to the Fire fighter guys and they will tell you this is the worse of worse they have ever seen with lack of humidity, intense heat, and wind. I would like to see precipitation accumulations from Jan through Aug 15!
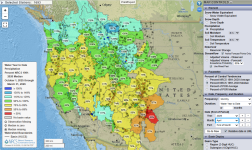
The Natural Resources Conservation Service (NRCS) falls under Farm Production and Conservation within the USDA. The water year runs from October 1 to September 30 of the following year and is a long established precedent.

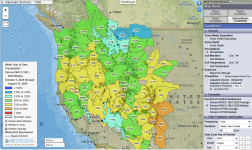
A lot of precip fell in the 1st quarter of this water year. I do not think I can pull up Jan 1 - year to date as a single report. I can pull up aggregated monthly reports from the beginning of the water year.
October - December.
1786906740119.png
October - March
1786908591646.png
October-June
1786908657048.png

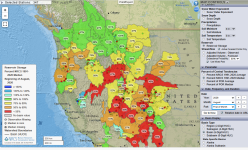
I have no formal training in all this but I'd like to know from members of the community who have the expertise if the current Reservoir Storage and Soil Moisture summaries I posted above & again below provide an indication of the current state of effective annual precip accumulation, (to include rain and snowpack) water year to date.

Does Reservoir Storage show how the accumulation of the current water year precip has been affected by regional temperatures and water usage (agricultural irrigation, thermoelectric power generation, public supply, industrial manufacturing, domestic household tasks...), water year to date?
1786910260803.png

AND, is NRCS Soil Moisture data at an 8-inch depth an indicator of how the long-term weather has affected dying of heavy dead fuels (1,000-hour fuels), and deep duff layers? Does it indicate the moisture percentage of the wood? What about cheat grass flammability?
1786909430291.png

Also, I was curious about this and a couple of searches brought up some national standards data from the Drought.gov National Integrated Drought Information System that were established in 2000
Percent of Normal Precipitation Values
When looking at raw precipitation totals expressed as a percentage of the 30-year climate normal (average), general meteorological thresholds often guide early alerts:

    • 80% to 100% of normal: Generally near normal conditions.
    • 50% to 75% of normal: Often correlates with developing moderate to severe dryness depending on seasonal timing.
    • Under 50% of normal: Frequently triggers severe to extreme meteorological drought definitions, especially if sustained over multiple months or during a primary rainy season. [1, 2, 3, 4, 5]
WA DOE uses this criteria and includes streamflow
Official State Criteria
    • Water Supply Threshold: Less than 75% of normal levels. [1]
    • Core Indicators:
      • Mountain snowpack levels (often sitting critically low, near 50%–68% of normal during drought years).
      • Streamflow measurements.
      • Soil moisture and cumulative precipitation deficits
1786914777844.png
 
Back
Top