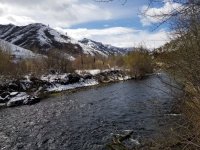
Yes, this late winter in April is a Godsend for the Central Oregon area and Oregon is general.

Follow along with the video below to see how to install our site as a web app on your home screen.
Note: This feature may not be available in some browsers.

It's data, from this government agency. It's not cable news.Do you think the NRCS is a reliable source or is this a group that benefits from negative predictions?

I link to the same one each time. But I was looking around and depending on how you enter the site and the variables that are selected the results are what varies. I need to make sure I'm looking at apples to apples, or water content to water content, or whatever choice of monitoring is.It's data, from this government agency. It's not cable news.
| Natural Resources Conservation Service
www.nrcs.usda.gov
Cynicism of data is killing this country. Most of it is unfounded. It's straight data from the same site and places as all the years before.
Most of what are presented is not data. We get plots that are someones interpretation of the data compared to what they feel is normal!It's data, from this government agency. It's not cable news.
| Natural Resources Conservation Service
Cynicism of data is killing this country. Most of it is unfounded. It's straight data from the same site and places as all the years before.

Most of what are presented is not data. We get plots that are someones interpretation of the data compared to what they feel is normal!
NRCS gives us a % based on what they think is normal. Their normal may be based on a motive to lobby Congress.
Cynicism is healthy..always question the data and consider the motivation of the source.
The NRCS plots are NOT data they are digital interpretations of the data.
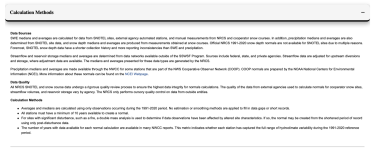
Sorry we disagree, NRCS is not data it is a percentage of something. Your Prineville plot is data...not an interpretation. I really like the plot you provided.Cynicism is not healthy, skepticism is. NRCS is data, and it is not based on what someone "thinks" is normal - it is the median of readings from the same locations for a given date from 1991 to today's date.
Sorry we disagree, NRCS is not data it is a percentage of something. Your Prineville plot is data...not an interpretation. I really like the plot you provided.
 www.nrcs.usda.gov
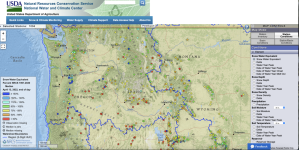


The entire east side of the state is in desperate need of an acquifier recharge, which would take multiple years of average snowfall.
A lot less red that 2 weeks ago, a bit more on the way, but unfortunately, @SSPey is correct; the overall trajectory is bleak.Not perfect, but dang it looks a lot better than a coupe weeks ago!
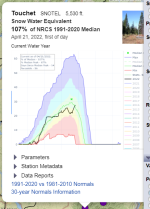

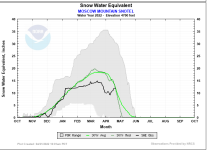 Yep yep! crazy to go from low to "average" in a few weeks, the melt rate will be very important though...