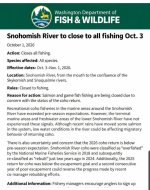
Snohomish System to Close 10/3

JayB

Life of the Party
Sounds like returns are way below previous years and expectations for this year, and from what I've heard the marine sport catch went way over the quota.

Hopefully the fish are just late and there'll be news about a re-opening soon.
 

Attachments

  • Screenshot_20261001_171925_Facebook.jpg
    Screenshot_20261001_171925_Facebook.jpg
    490.9 KB · Views: 11
I less concern about whether there will be a re-opening and more concern that given the great catches in the salt (the number of unmarked coho estimated to have been caught in MA 8-2 is more than 250% of the expected catch) will limit the Snohomish wild coho to levels below that which would trigger an "over-fished" status. That over-fished status is trigger if the 3-year Geometric mean of wild coho escapement falls below 50,000. A quick check it looks like if the 2026 Snohomish wild coho escapement is less than 43,000 (pre-season forecast was 75,800) that over-fished status would be declared.

I think most can remember the difficulty the recent over-fished status for Snohomish coho caused in attempting to schedule coho fisheries in MA 9 and/or MA 8-2.

Curt
 
I less concern about whether there will be a re-opening and more concern that given the great catches in the salt (the number of unmarked coho estimated to have been caught in MA 8-2 is more than 250% of the expected catch) will limit the Snohomish wild coho to levels below that which would trigger an "over-fished" status. That over-fished status is trigger if the 3-year Geometric mean of wild coho escapement falls below 50,000. A quick check it looks like if the 2026 Snohomish wild coho escapement is less than 43,000 (pre-season forecast was 75,800) that over-fished status would be declared.

I think most can remember the difficulty the recent over-fished status for Snohomish coho caused in attempting to schedule coho fisheries in MA 9 and/or MA 8-2.

Curt
Bit puzzling to me that the WDFW wasn't able to compile the catch data in a more timely manner and make 8-2 mark selective like area 9 when there were clear signs that the unclipped catch was going over the quota given that they had access to the fish-counter data from the ramps and electronic catch-card data.

Seems like so long as they took the appropriate precautions to avoid double-counting fish reported on the app that were subsequently counted at the ramp they'd have a fairly good real-time estimate of how many fish of what type were being retained in which Marine area and could change the regs accordingly. Must some reason why they aren't that isn't apparent to civilians.
 
Bit puzzling to me that the WDFW wasn't able to compile the catch data in a more timely manner and make 8-2 mark selective like area 9 when there were clear signs that the unclipped catch was going over the quota given that they had access to the fish-counter data from the ramps and electronic catch-card data.
All summer long I and several others have been receiving WDFW coho catch updates for MA 8-2, MA 9 and MA 10 (result of asking for such info during NOF). Once those areas opened up the catch was consistently above expected levels. The latest update was titled "in-season estimates of effort and salmon catch (retained and released) from private boats during the area 82 summer coho fishery August 1 to September 25, 2026."

Some of the highlights
31,597 angler trips
31,836 retained including 18,895 unmarked
1,523 unmarked released
5,095 Chinook encountered (740 marked, 1,000 unmarked, and 3,305 unknown)

That 31,836 coho retained in MA 8-2 is a huge number. A quick review of the MA 8-2 coho catches back to 1995 showed that previous to this year the largest catch was 21,968 in 2001 (BTW the wild Snohomish catch spawning escapement was 261,647!).

Also checked with the Tulalip web site and found their coho catch to date is the third lowest in the last 10 years. Does not appear that there is some large school of holding off the mouth of the Snohomish. I don't see any evidence that the run is particularly late; in fact, those large catches in August and early September in MA 8-2 and MA 9 argue the opposite.

Bottom line WDFW had ample information/evidence to act in more timely manner. Suspect that north central sound and Snohomish anglers will be "paying" for this year's fishery next year and maybe longer.

Curt
 
All summer long I and several others have been receiving WDFW coho catch updates for MA 8-2, MA 9 and MA 10 (result of asking for such info during NOF). Once those areas opened up the catch was consistently above expected levels. The latest update was titled "in-season estimates of effort and salmon catch (retained and released) from private boats during the area 82 summer coho fishery August 1 to September 25, 2026."

Some of the highlights
31,597 angler trips
31,836 retained including 18,895 unmarked
1,523 unmarked released
5,095 Chinook encountered (740 marked, 1,000 unmarked, and 3,305 unknown)

That 31,836 coho retained in MA 8-2 is a huge number. A quick review of the MA 8-2 coho catches back to 1995 showed that previous to this year the largest catch was 21,968 in 2001 (BTW the wild Snohomish catch spawning escapement was 261,647!).

Also checked with the Tulalip web site and found their coho catch to date is the third lowest in the last 10 years. Does not appear that there is some large school of holding off the mouth of the Snohomish. I don't see any evidence that the run is particularly late; in fact, those large catches in August and early September in MA 8-2 and MA 9 argue the opposite.

Bottom line WDFW had ample information/evidence to act in more timely manner. Suspect that north central sound and Snohomish anglers will be "paying" for this year's fishery next year and maybe longer.

Curt

I wonder what drove that level of amazing fishing in the salt without an overly large run size?
 
Might not have been so amazing if the catch wasn't so far over the quota...but until redd counts and escapement numbers are figured, hard to say.

If the catch was less than half of actual this year (250% of the quota as mentioned earlier) fishing wouldn't be described as amazing I'd guess.
 
Might not have been so amazing if the catch wasn't so far over the quota...but until redd counts and escapement numbers are figured, hard to say.

If the catch was less than half of actual this year (250% of the quota as mentioned earlier) fishing wouldn't be described as amazing I'd guess.

Yeah that could be. Just heard lots of people saying it was the best fishing they’ve seen In decades in 8-2 and 9. As far as numbers of fish around, not size. Il be curious how it plays out.

Definitely not cool that the salt always wins out at the rivers expense…..
 
Suspect that north central sound and Snohomish anglers will be "paying" for this year's fishery next year and maybe longer.

Curt
-The tin-foil-hat part of my brain wonders if that was the point. Overharvest ---> System Wide Closure ---> No Monitoring/Enforcement + Happy Co-Managers. The majority of my brain is running the "Never assume malice is necessary when incompetence is sufficient" code, but...

-The catch in 8-2 this year really was astounding compared to the predicted Snohomish/Stilliguamish return of ~161K. I asked an AI to pull the data for combined Snohomish/Stilliguamish run sizes and reported sport catch going back to 2000 and the output for 2001 was ~477K combined returns and an 8-2 sport-harvest of ~22K. It looks like for most of this century the 8-2 sport catch has been constrained by regulations rather than abundance, but in a years like 2012-13 where it seems like there were relatively few restrictions the combined forecast for the Sno/Stilli coho run was ~270k and ~277K the sport harvest was 13K and 10k. There may be a hallucination or two embedded in there but it seems like the data series it generated is at least directionally correct. Taken all together it makes this year's management decisions even more baffling.
 
Before the river wild coho FOMO gets out of hand here, it's important to remember that MA9 and 8-2 seasons now end September 30th. Wild coho release in MA9 was mandatory until Sept 19th with daily limit dropped to 1 fish on Sept 21st. The main potential error was allowing wild coho harvest for so long in 8-2.
 
Well 250% over is a bit more than a rounding error, but no doubt gave for some good fishing.

Now the piper is coming around however.

Wild Coho thing is baffling, but I'm not an expert on the data.
 
I'd like to know exactly where the "31,836 retained" number came from. How much of that is an estimate versus actual data? Is it 100% comparable to all past years data, or does it have some change from past years, like the electronic catch data coming into it? That's the first thing to figure out, making sure it's apples to apples.

I don't know a ton about how the predictions are derived, but my sense is that our current management systems can't handle actual returns that are either much lower or much higher than the pre season estimate. When lots of fish come back, or behave differently, from expectation, everything seems to not work correctly on the management side.

Hard to tell right now if it's a problem with the estimate, or the actual, return..
 
I'd like to know exactly where the "31,836 retained" number came from. How much of that is an estimate versus actual data? Is it 100% comparable to all past years data, or does it have some change from past years, like the electronic catch data coming into it? That's the first thing to figure out, making sure it's apples to apples.

I don't know a ton about how the predictions are derived, but my sense is that our current management systems can't handle actual returns that are either much lower or much higher than the pre season estimate. When lots of fish come back, or behave differently, from expectation, everything seems to not work correctly on the management side.

Hard to tell right now if it's a problem with the estimate, or the actual, return..
I was curious about that too. I'm going to download the CSV file for this year's creel reports when I get a minute and compare the sum total Harvest for 8-2 coho at all of the ramps and see where what it amounts to.

I'm sure that's only part of the data that they use, and all gets tossed into a fairly complicated formula, but I am curious about what number you get when you just add up the creel reports.
 
Bit puzzling to me that the WDFW wasn't able to compile the catch data in a more timely manner and make 8-2 mark selective like area 9 when there were clear signs that the unclipped catch was going over the quota given that they had access to the fish-counter data from the ramps and electronic catch-card data.
Seems like so long as they took the appropriate precautions to avoid double-counting fish reported on the app that were subsequently counted at the ramp they'd have a fairly good real-time estimate of how many fish of what type were being retained in which Marine area and could change the regs accordingly. Must some reason why they aren't that isn't apparent to civilians.

I'd like to know exactly where the "31,836 retained" number came from. How much of that is an estimate versus actual data? Is it 100% comparable to all past years data, or does it have some change from past years, like the electronic catch data coming into it? That's the first thing to figure out, making sure it's apples to apples.
I don't know a ton about how the predictions are derived, but my sense is that our current management systems can't handle actual returns that are either much lower or much higher than the pre season estimate. When lots of fish come back, or behave differently, from expectation, everything seems to not work correctly on the management side.
Hard to tell right now if it's a problem with the estimate, or the actual, return..
I don't quite know where to post this since we have several threads on the topic of "Coho coming up short" and impacts on management changes in several systems, let's try here first. There was a WDFW presentation last month (Augus 2026) on the implementation of Electronic Catch ReportingCards (eCRC), sport harvest estimates timeline and more,

In short, no double counting, 2026 is considered a Pilot year where harvest estimates are still done using the previous methods while new ones are developed, 2027 is considered a test year where new methods are evaluated and considered for adoption depending on performance and co-managers agreement.

More highlights from the full presentation last 2 slides:

* The paper CRC system has reached its limits: 18–24-month reporting lag, bias correction factors for salmon dating to the 1980s, no accounting for released fish

* eCRC speeds up the catch reporting timeline• Near real-time reporting — days, not months — enabling in-season management and faster coastwide response

* A staged pathway to better estimates: Statewide expansion immediately, fishery-specific creel data correction next, statistical models as data accumulate; Integrates and leverages creel rather than replacing it;

* Proposed estimation approaches leverage creel data for real-time ongoing catch expansion and bias correction rather than replacing creel as a catch estimation and sampling platform

* Creel surveys maintained per co-manager agreements

* 2026 — Pilot Year: Protocols and databases modified for eCRC data collection; Estimation methods developed, coded, and piloted; Approach for eCRC model evaluation developed (cross validation); Anglers may report by paper CRC or eCRC; Harvest still estimated using established methods

* 2027 — Test Year:
Test eCRC harvest estimates; Could vary fishery to fishery when we “switch” methods used in management; Transition depends on estimate performance, tribal agreement

See below for the actual presentation if you want to get further into the weeds:

 
Last edited:
FWIW the total number of coho retained in MA 8-2 per the creel reporting data available in the CSV I downloaded a few minutes ago is 13,949. August = 3,934. September = 10,015, based on 209 reports representing 15,237 anglers. Everett = 10,817. Mukilteo = 2,252. Camano Island State Park = 590. Dagmar's = 217. Shilshole = 32. Kingston = 32. Other ramps = 9.
 
FWIW the total number of coho retained in MA 8-2 per the creel reporting data available in the CSV I downloaded a few minutes ago is 13,949. August = 3,934. September = 10,015, based on 209 reports representing 15,237 anglers. Everett = 10,817. Mukilteo = 2,252. Camano Island State Park = 590. Dagmar's = 217. Shilshole = 32. Kingston = 32. Other ramps = 9.
Those are just the unexpanded sampled fish, it is not a census sampling, you have to factor in the sampling rate, which varies by area, year. See for example the 2024 Puget Sound Coho post-season report at the link below, Table page 31 shows a sample rate of around 42% for Area 8-2 Summer coho. Assuming simmilar sample rates result in expanded numbers in the ballpark of those reported by @Smalma

 
Yeah when you take the raw numbers from the creel reports, factor in the fact that there aren't people stationed at every ramp every day, and all of the other parameters that they feed into the model, it doesn't seem like a stretch to get a total catch in the ballpark of what the wdfw has calculated for marine area 8-2.

The in-season management decisions are still a bit of a mystery, but I'm sure it's possible to find an explanation if you dig deep enough.
 
Fish checkers dont have access to the docks blocked by locked gates in some marinas. I dont know how they calculate the catch from places like Edmonds which has a lot of small boats.
 
Fish checkers dont have access to the docks blocked by locked gates in some marinas. I dont know how they calculate the catch from places like Edmonds which has a lot of small boats.

They actually have people in boats on some days going around the fleet asking everybody what launch/marina/etc they came from.
 
  • Like
Reactions: CRO
They actually have people in boats on some days going around the fleet asking everybody what launch/marina/etc they came from.
unfornunately unless you get get the absolute catch from each boat(retained, marked, unmarked, released) and a truthful response from each boat . There are a lot of variables to figure in your catch per unit effort.
 
Back
Top